


A lot of finance teams already use Excel every day. If there's already a data model built in your environment, you'd be able to use it directly in Excel - browsing it, slicing it, building your own views, all in a self-service way. So once a data model, or semantic model, exists, what you can do next is use it in Excel and browse it. That's what we'll walk through below.
What Is a Data Model?
A data model is a mechanism for grouping all your data into a central place. A typical data environment in corporations has multiple systems - an ERP system, an expense system, an HR system, maybe a supplier or vendor system - and the data on those systems tends to be spread across multiple tables. That's efficient for storing and retrieving data, but it makes browsing your data, joining it up, and building a report with the KPIs the company cares about cumbersome.
A data model solves this by hiding that complexity. The joining, the defining of relationships, and figuring out all the tables you need to combine happens on the back end. By the time you see your data model, it's grouped into logical entities such as:
- Customer information
- Vendor information
- Product information
- KPIs (revenue, cost, profit margin) - already linked to products and customers
All you need to do is drag the information you're looking for and view it against the KPI you're interested in.
The data model is typically built as a star schema - it looks like a star. The middle table is the fact table, where all your KPIs and measures live. Surrounding it are the dimensional tables - the different entity groupings like customer information, product information, and employee information. Everything is linked to your KPIs, so all your data ends up grouped in a logical way.
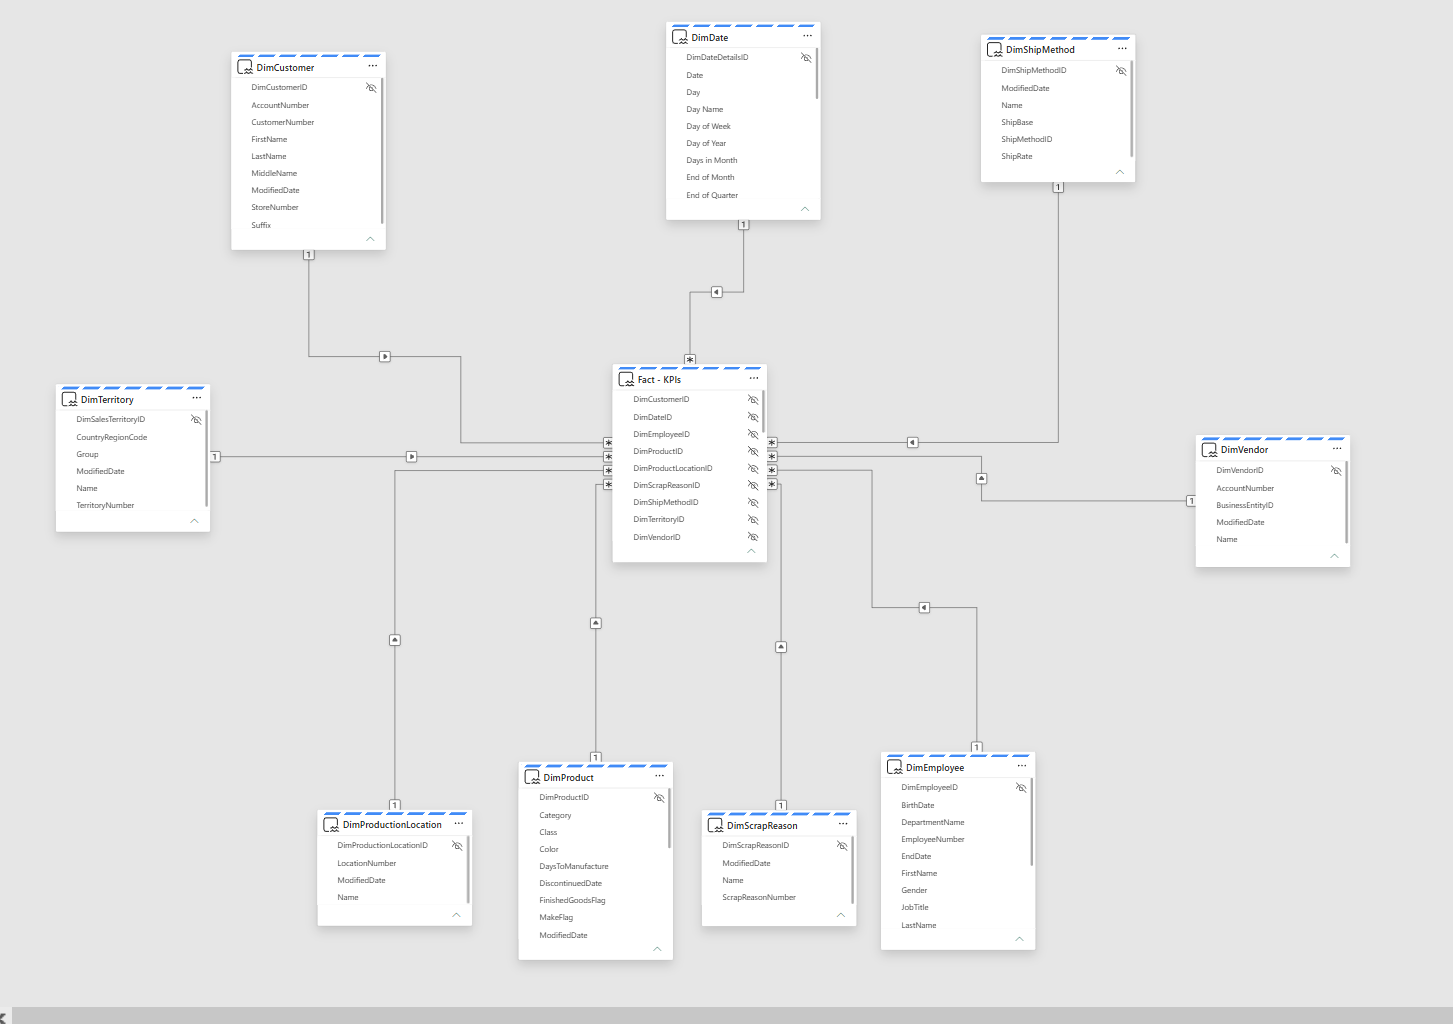
What the Demo Covers
Rather than walk through every click, here's the high-level shape of what we cover in the video:
Finding the data model in Fabric. If your organization already has a semantic model set up - that's your starting point. No need to build anything from scratch.
Connecting from Excel. Excel can pull that model in directly through Data → Get Data → From Fabric and Power Platform → From Power BI. As long as you have permissions to the workspace, you'll see all the tables from the data model show up, ready to drop into a PivotTable.
Building views with a PivotTable. Once connected, it's a normal PivotTable experience - drag Category and Subcategory into Rows, Gross Profit into Values, filter on what you need. Nothing about it is different from any other pivot table you've built.
Using the date dimension. One of the perks of a proper data model is a date dimension - fiscal year, fiscal quarter, fiscal month - already linked to your KPIs. Drag Year and Month into the view and you can see profit split out by time period in seconds.
Keeping it fresh. You can refresh the data anytime by right-clicking in Excel. The actual refresh - pulling from the different source systems and linking it all up - happens on the Fabric side. That's the point: everyone is looking at the same numbers, refreshed on the same schedule, instead of everyone pulling data at different times of the day.
Wrap-Up
That's the value of having one view of the data, one data model, used across the organization. If you want the full click-through of getting connected and building this out yourself, that's in the video.